
Mathematical Ability at BYU
What can we learn about my peers' performance on a fascinating math puzzle?

Since I was a little kid, I have always been fascinated by numbers, math, and data. One of my earliest memories, in fact, was counting numbers to myself which I thought at the time were exorbitantly high in preschool. “Four hundred thirty, four hundred thirty-one…” I don’t know about you but I don’t think that is very typical behavior for a four-year old kid! As I got older, my interest in this field continued to expand as I continued venturing into new depths of learning and knowledge. Now on the verge of twenty and completing my sophomore year at Brigham Young University, my desire to learn has never been higher.
I’ve also always loved to write about technical stuff. Being able to explain things that interest me in a way that is accessible to others is something I really enjoy. Recently, I was taking a look at some of my favorite data guys such as Nate Silver and Ryan Burge and noticed this website that seemed to attract people of that type. While I don’t expect to attract a huge audience, I came to a reckoning that maybe I should pick up this cool new hobby of blogging about the things I really love. So why not start with a bit of a numbers game?
I had the opportunity to take a really interesting class at BYU this semester: STAT 230 (Analysis of Variance) from Dr. William Christensen. This class was just awesome. I got to learn more about not just the nitty-gritty equations that usually accompany us on a formula sheet during an exam, but how to actually set up a model—how to design an experiment.
For STAT 230, our term project was to design, run, and analyze an experiment in a group of four people. Just a few days before our group assignments were made, I had rediscovered a puzzle that I had previously had experience with: Figure Weights.
What is Figure Weights anyway?
Figure Weights is one of the subtests that compose the most modern versions of the Wechsler I.Q. tests. Figure Weights is essentially an abstract representation of an algebra problem presented in the form of two or more balanced weights with one missing option. It measures quantitative (numerical) reasoning at all levels and working memory at advanced levels.
I’ll let you have a gander at one Figure Weights problem:
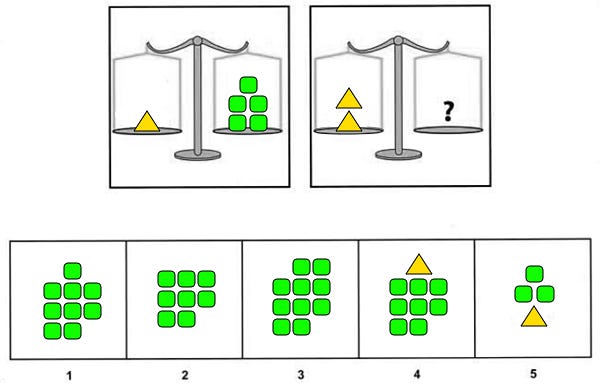
If you selected option 3, you are correct! The key is to identify what the triangle is equivalent to: five green squares. Now that we know that 1 triangle = 5 green squares, we can generalize this as 2 triangles = 10 green squares. Option 3 satisfies this requirement. We can also present this as a simple logical implication.
Of course, it wouldn’t be a proper I.Q. test if the ceiling wasn’t astronomically high in order to measure prodigious ability. All subtests in the U.S.-normed versions of the WAIS-IV and WISC-V have a maximum subtest scaled score of 19 with μ=10 and σ=3. Or so to speak, they can measure three standard deviations above the mean. This corresponds to just under the 99.9th percentile. (Theoretically the WISC-V extended norms can elevate the ceiling beyond 19ss for children under the age of 14 years and 3 months but this is beyond the scope of our discussion. No such extended norms exist for WAIS-IV.)
While the clinical versions of these tests are legally gated to licensed psychologists, people have made replicas that use different problems but emulate the same concepts. The most widespread version online is called CAIT and contains a Figure Weights test which purports to measure as high as four standard deviations above the mean.
Quick personal anecdote: I took the “real” version of the Figure Weights in 2017 and the CAIT version in 2022 and got the same standard score on both. At the risk of falling victim to confirmation bias, I think this at least implies that the fan-made test is decently accurate!
The test in real life
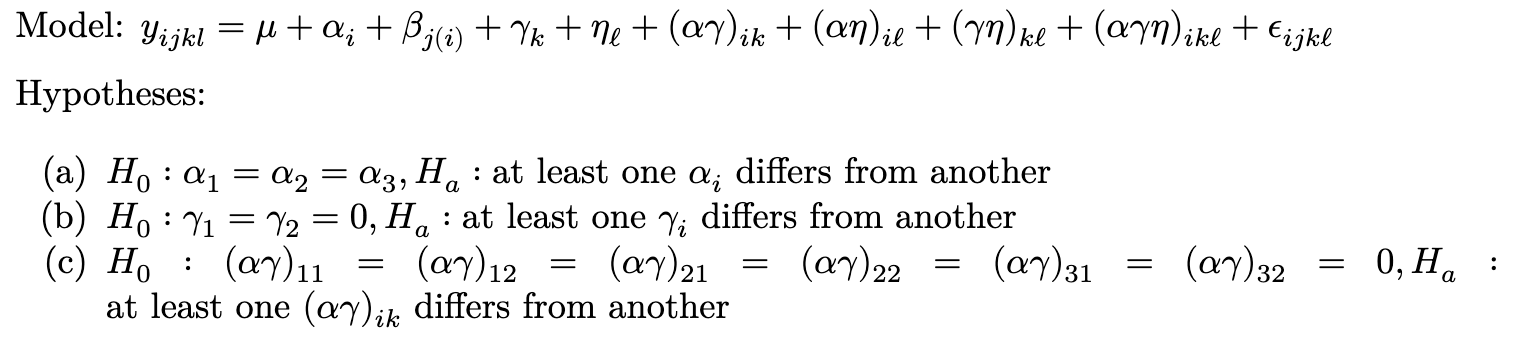
I hope by now I’ve made it clear that I really love math and puzzles! So the first day we met as a group, the nerd in me proposed the Figure Weights puzzle, and all my teammates loved it. We decided to design an experiment to test if the following two factors influenced performance on the CAIT Figure Weights:
Level of background music. We would introduce three levels: silence, classical (Canon in D by Pachelbel), and metal (Master of Puppets by Metallica). We hypothesized that there would be an inverse relationship between musical “intensity” and FW performance.
Can you show your work or not? A lot of these problems, especially at the 13ss (high average) level and above, have a significant working memory demand. We hypothesized that if people could show their work, they would perform better than if not.
We recruited twenty-four participants who were all active students at Brigham Young University and split the full set of 26 problems into two sets of 13 (which oscillated w.r.t. the original set of problems in a tick-tock-tick-tock pattern). Initially, our model structure was an RM[1;2] (repeated measures with one within-block factor and two inner-block factors), but we realized that there were some complications with not every treatment combination being covered, so we made the statistical assumption that Forms A and B were equivalent, effectively reducing the model to an RM[1;1].
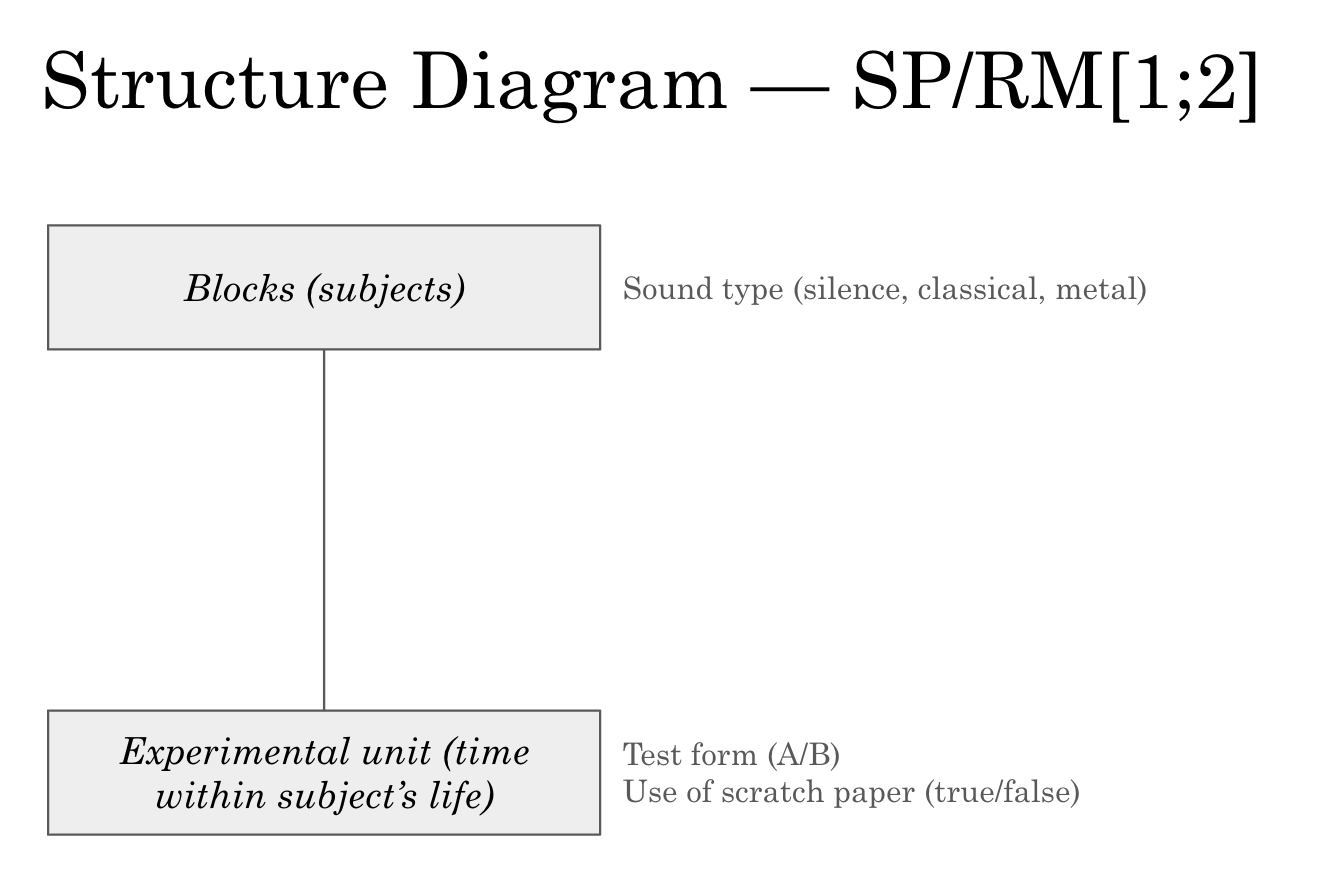
The final model was essentially the same as these screenshots but with “Test form (A/B)” dropped.
What did we learn?
After administering all the tests and performing ANOVA in R, we found some surprising results right off the bat.
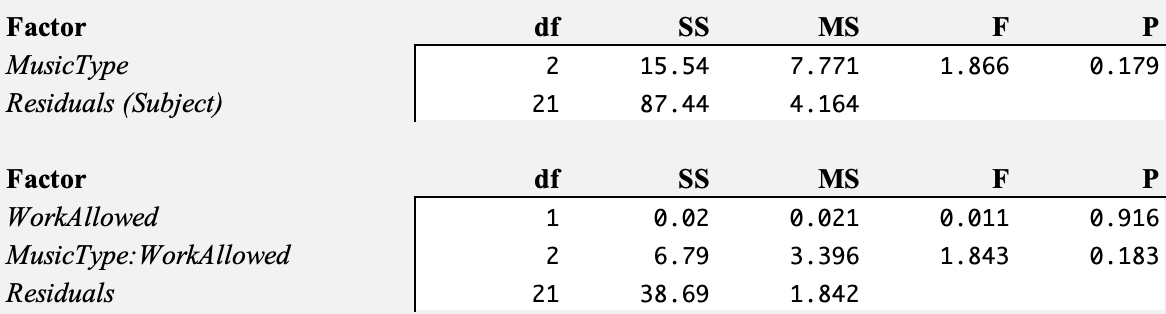
Neither music type nor work allowed had a statistically significant effect! Our hypotheses were straight up false; peoples’ performance on Figure Weights was the same regardless of their treatment combination. Therefore, we failed to reject any of the three null hypotheses we initially proposed.
In our official report, this was essentially the gamut of our conclusion. But my interest in cognition does not stop here.
Our results showed that among this (admittedly small) sample of BYU students, the average raw score on Figure Weights was 16.46 with a standard deviation of 2.99. This reflects very well with the CAIT sample that demonstrated a standard deviation of 3.00 with the national average raw score being 14.00. Using the following formula
we find that the average Figure Weights performance among BYU students is approximately 0.82 standard deviations above the mean, or the 79th percentile. Yippee! We’re above average!
The discordance with the ACT score
BYU is a school known for its high work ethic. Depending on the ranking scheme, it places anywhere between 20th and 120th in the nation; let’s average it out and say BYU is roughly the 75th best institute of higher education in America. Its ACT scores are quite impressive with an average of 30 (IQR 27–32) and SAT scores are very similar with an average of 1360 (IQR 1290–1440). According to the latest 2023 norms published by both ACT and College Board, these numbers would correspond to an average test score between the 91st and 95th percentile.
So what explains the difference between the average FW test and the average ACT score? The simple answer is that FW (nor any IQ score) does not directly correlate to academic test scores. I suspect that because BYU students are so freakin’ motivated and applied to their schooling, they are likely to outperform whatever they would score on a proctored I.Q. test.
Pearson has published intercorrelation tables for the WISC-V as part as its Technical Manual supplement. Averaging the FW:FSIQ correlation values for age bands 14–16 (at least high school-aged people), we find that the overall correlation between Figure Weights performance and Full-Scale Intelligence Quotient is 0.75. Using the concept of regression to the mean and making the bold assumption that there is no significant difference between WISC-V, WAIS-IV, and CAIT FW scores, this implies that the average I.Q. score at BYU might be
Using the qualitative definitions provided in the WAIS-IV, this infers that the average I.Q. score at BYU is Average! This is not a result I quite expected to find, but it does support my final argument.
What does this mean?
I.Q. scores are probably one of the most misunderstood concepts in psychology—and that’s saying something, because there’s a lot of misconceptions in psychology. Everyone is so fascinated in themselves and others, but at the end of the day, despite so many leaps and bounds made since Freud, we are still so dang far from really understanding the true complexity of our minds.
Some people put way too much stock into I.Q. They might have taken one of those tests, often endemic on Facebook and advertisements. They likely solved a few simple puzzles like anagrams or math word problems and were told that they were smarter than Einstein. Other people may believe the entire notion of an I.Q. test is malarkey and that it is not possible or appropriate to even approximate innate ability using non-holistic means. Still others have received an extremely high score on a proctored test as a child but have squandered their potential later in life for other reasons. The truth is that I.Q. tests have their virtues and downsides—of which both should be acknowledged.
While I only made an estimate on I.Q. scores at BYU using rudimentary statistical methods and a scant sample size, I think it’s fair to conclude that I.Q. scores taken in isolation are not enough to really prove one’s potential. In my anecdotal experience, the most successful people I know had the highest work ethic and took the greatest advantage of their resources. Even though the median BYU student may be statistically average (or slightly above average for that matter), it is clear that hard work and perseverance is the reason why so many of my peers have managed to accomplish spectacular test scores and do well in many facets of their lives.
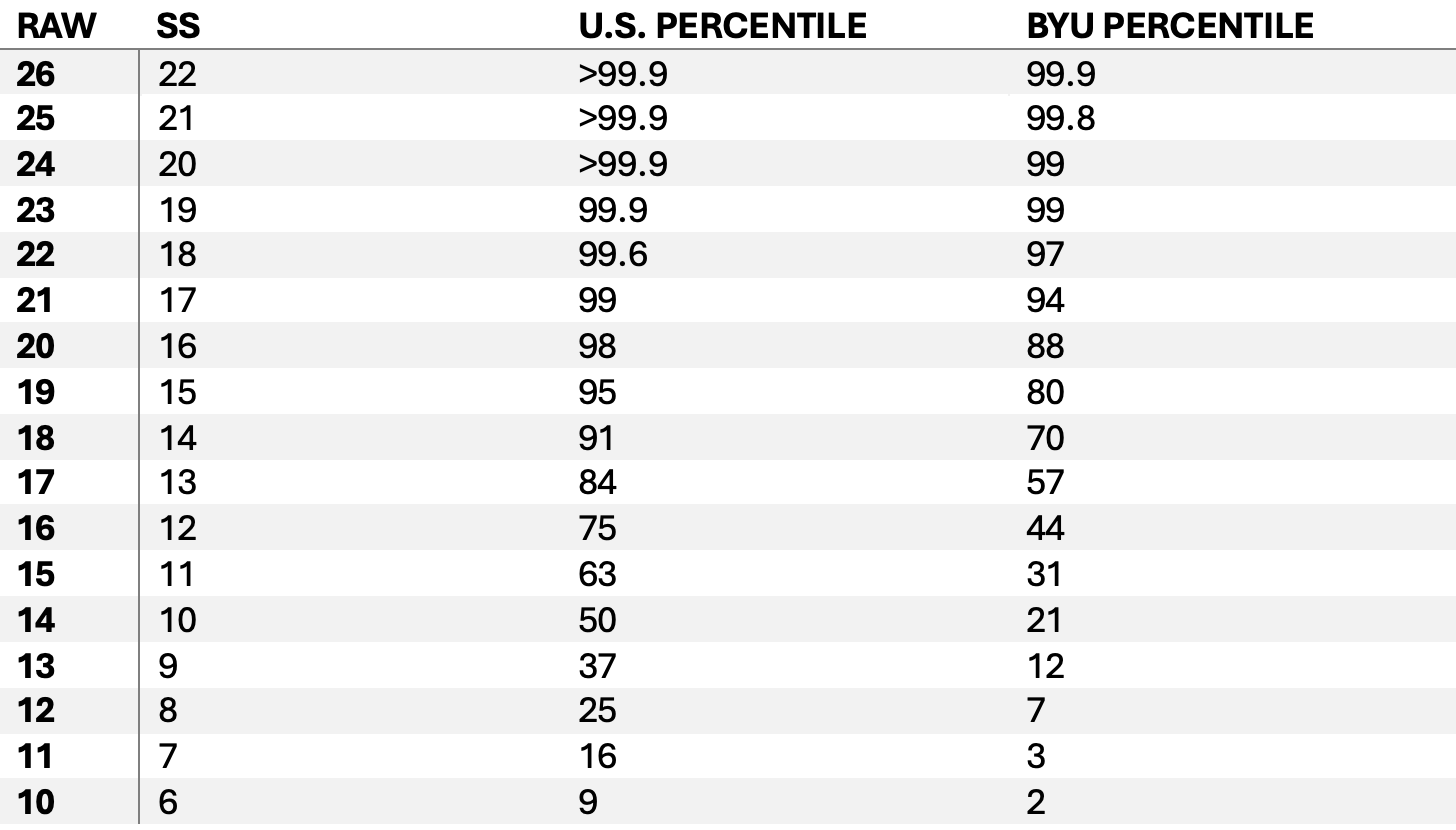
Appendix: Score Distribution
Thank you to my STAT 230 team members for helping me make this experiment an unequivocal success.
CAIT website report a SS average score of 13.38 for FW which correspond to > 17 of raw score. But I have little knowledge of statistics
What about the correlation between figure weight performance and mathematics/science performance on the ACT?